Kauai Market Report · July 2026 — Data Through June 2026
All three property segments — residential, condo, and land — are now buyer's markets. But each is cooling in a distinctly different way, and what that means for buyers and sellers varies considerably by category.
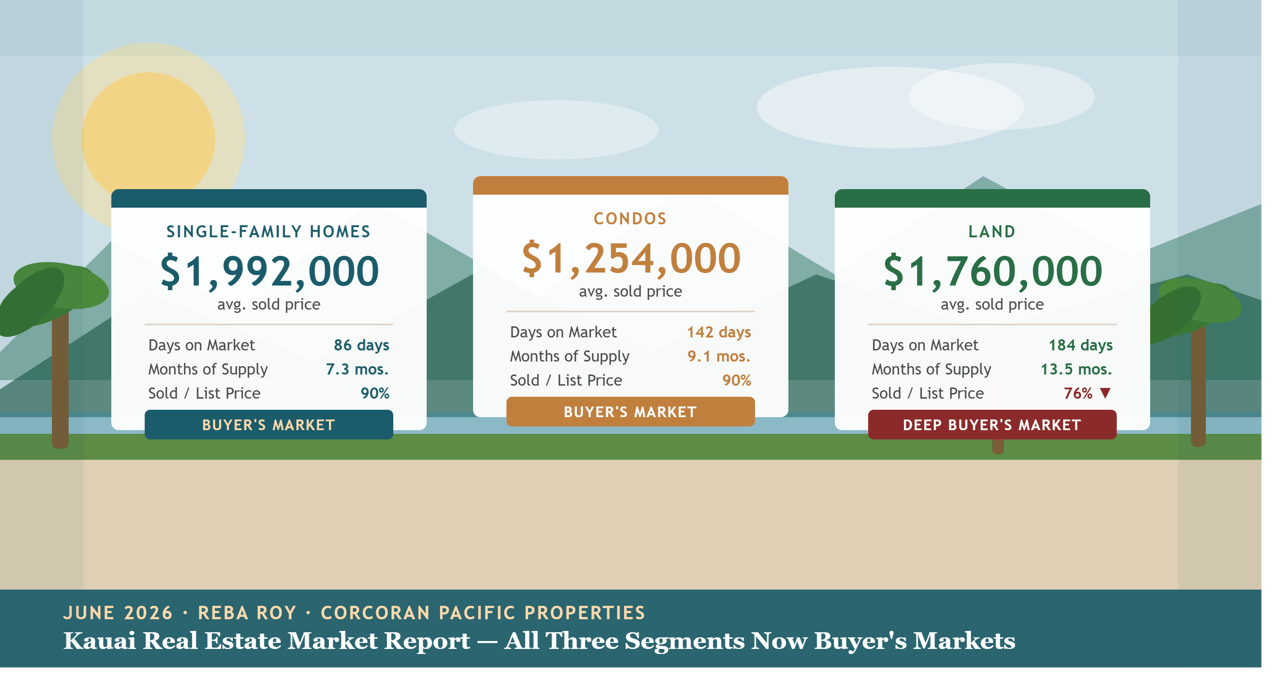
At a Glance — June 2026
86 days on market · 90% of list
7.3 months supply
142 days on market · 90% of list
9.1 months supply
184 days on market · 76% of list
13.5 months supply
The Big Picture
June 2026 is a buyer's market across all three Kauai property segments. But the way each segment is cooling tells three different stories — and reading the right one matters for buyers and sellers making decisions right now.
Residential saw the sharpest single-month shock: sales fell 32.6% year-over-year, inventory jumped nearly 13% in a single month, and months of supply snapped from a near-neutral 4.6 reading in June 2025 to a firm buyer's-market 7.3 in June 2026. That's a significant move — but in a market with only 29 closings a month, one or two fewer transactions can produce dramatic percentage swings.
Condo's slowdown has been steadier and more structural. Days on market has climbed in four of the last five reporting periods — from 54 days in June 2024 to 142 today — with no reversal in sight. That's not noise; that's a market where buyers are taking more time and sellers need to plan accordingly.
Land is the thinnest, slowest, and most seller-concessive of the three. With only 8 closings against 108 active listings and sellers accepting an average of just 76 cents on the original dollar — down from $1.06 a year ago — it's the segment requiring the most realistic pricing expectations.
"Residential and condo both sit at 90% of original list price. Land sellers are closing at just 76% — the widest seller concession of any segment in the trailing two-year window, and a 30-point swing from a year ago."
National: Existing-home sales slipped 2.4% month-over-month in June to a 4.09 million annual rate, though they were still up 2.8% year-over-year. The national median price hit an all-time high of $440,600, up 1.8% YoY. Median days on market: 28.
Hawaii statewide: The median home price rose 8% YoY to $1,079,000; the median condo price rose 3% to $546,500. Home sales fell 5% YoY while condo sales rose 14%.
Kauai vs. the state: Kauai runs well above both figures — average residential sold price of $1,992,000 and average condo sold price of $1,254,000. Kauai's residential sales decline (-32.6% YoY) was far sharper than the statewide drop (-5%). Kauai condos dipped slightly (-4.8%) while the state rose 14%.
Residential Market Buyer's Market
Closed sales fell to 29 in June — down 32.6% from 43 a year ago and down 21.6% from May. Active listings rose to 212, up 12.8% in a single month. The result: months of inventory jumped to 7.3, up 58.3% year-over-year and well into buyer's-market territory.
The more reliable price indicator — average sold price per square foot — fell to $1,046, down 4.7% year-over-year and down 8.4% from May. Average sold price came in at $1,992,000, down 11.1% year-over-year, but that headline number is heavily influenced by the mix of luxury versus entry-level closings in any given month. The $/sq ft figure is the cleaner read on underlying value direction.
Looking at the three-year data, active residential listings have climbed steadily from 117 to 212 — an 81% increase in supply — while sold volume has actually fallen. That supply build, not absorbed by buyer activity, has translated directly into rising months-of-inventory rather than a market flush with activity.
Residential — Two-Year Trend
Jun '24 | Dec '24 | Jun '25 | Dec '25 | Jun '26 | |
|---|---|---|---|---|---|
Closed Sales | 23 | 28 | 43 | 37 | 29 |
Avg. Sold Price | $1,940K | $2,189K | $2,240K | $1,526K | $1,992K |
Avg. $/Sq Ft | $1,178 | $1,052 | $1,098 | $900 | $1,046 |
Avg. Days on Market | 107 | 99 | 73 | 62 | 86 |
Months of Inventory | 6.4 | 6.3 | 4.6 | 5.2 | 7.3 |
Condo Market Buyer's Market
Condo closed sales held relatively steady at 20 — down only 4.8% year-over-year. But the steadier volume masks a meaningful structural shift: days on market has climbed almost every reporting period for two years, reaching 142 days in June — up 61.4% year-over-year and the highest reading in the trailing two-year window.
Average sold price jumped to $1,254,000, up 40% year-over-year, and price per square foot rose 22.8% to $995. That sounds like appreciation, but the more likely explanation is a mix shift — higher-value units are the ones finding buyers, while more modestly priced condos are sitting. The climbing days-on-market confirms this: a broad-based price rise doesn't usually come with four straight periods of lengthening market times.
Months of inventory now sits at 9.1 — the steadiest upward climb of the three segments, with no reversal in the data over the past two years.
Condo — Two-Year Trend
Jun '24 | Dec '24 | Jun '25 | Dec '25 | Jun '26 | |
|---|---|---|---|---|---|
Closed Sales | 27 | 19 | 21 | 18 | 20 |
Avg. Sold Price | $1,042K | $1,088K | $896K | $837K | $1,254K |
Avg. $/Sq Ft | $882 | $1,013 | $810 | $917 | $995 |
Avg. Days on Market | 54 | 62 | 88 | 114 | 142 |
Months of Inventory | 4.7 | 7.9 | 8.2 | 8.9 | 9.1 |
Land Market Deep Buyer's Market
Land is the smallest and least liquid segment — only 8 closings against 108 active listings in June, a turnover rate under 8%. New listings were equally thin at just 7, so this isn't a supply-wave story; it's a market with a persistently small buyer pool.
That low transaction count makes every land metric noisier than the others. Average sold price of $1,760,000 is compiled from just 8 closings, and has ranged from $626,000 to $4,239,000 over the trailing two years purely based on which parcels happened to close. The price-per-square-foot metric isn't applicable to land; MLS data uses acreage rather than building square footage.
The clearest and most consistent signal: land sellers are closing at just 76% of their original asking price — down from 106% exactly one year ago. That is the single largest one-year swing in any metric across all three property types. Average days on market of 184 is the longest of the three, more than double residential's 86 days.
Land — Two-Year Trend
Jun '24 | Dec '24 | Jun '25 | Dec '25 | Jun '26 | |
|---|---|---|---|---|---|
Closed Sales | 6 | 10 | 6 | 7 | 8 |
Avg. Sold Price | $917K | $1,761K | $1,119K | $1,334K | $1,760K |
Avg. Days on Market | 109 | 252 | 147 | 165 | 184 |
Months of Inventory | 17.2 | 10.3 | 18.2 | 15.9 | 13.5 |
Sold / Orig. List % | — | — | 106% | — | 76% |
What This Means for Buyers & Sellers
- Don't anchor to last year's sale prices — values have been quietly softening
- Buyers are currently negotiating to roughly 90% of original ask
- Price to today's market from day one — chasing the market down after a high list is more costly than pricing correctly at the start
- Active listing count is up 81% over three years; buyers have real choices
- Budget for 4–5 months of market time — 142-day average DOM is not an outlier, it's the trend
- Price competitively from the first day; condo DOM has nearly tripled in two years
- Well-priced units in desirable locations are still moving — the market hasn't stopped, it's just slower
- Expect the longest hold of the three categories — 184 days average to close
- Price with genuine room to negotiate; buyers are currently securing 24% off original list on average
- Overpricing a lot rarely leads to a slow negotiation — it leads to months with no activity at all
- With 7.3–13.5 months of supply across all three segments, there is no urgency pressure
- Negotiating room exists in every category — widest in land, meaningful in condo and residential
- Include inspection and financing contingencies; sellers are in a position to accept them
- Shop by price-per-square-foot for residential and condo, not headline price alone
The full report — including all data tables, two-year trend comparisons, national and state context, and detailed segment analysis — is available for download below.
What Does This Mean for Your Property or Search?
Every property on Kauai sits within a specific neighborhood, price range, and property type — and each of those has its own story right now. I'm happy to walk through a personalized analysis of what today's market means for your specific situation, whether you're thinking about selling, actively buying, or just trying to understand where things stand.
Warm Aloha,
Reba Roy, REALTOR®
Corcoran Pacific Properties · RB-23783
Serving Kauai & the Hawaiian Islands
Source: HiCentral MLS / Hawaii Information Service data via Kauai market reports, published July 2026 based on data through end of June 2026. Kauai figures are reported as averages per the source MLS; national and state figures are medians. Information deemed reliable but not guaranteed. National data sourced from NAR existing-home sales report, June 2026.