Market Overview
Status: Neutral
Property Overview
Property Types: All Single Family Res Properties - Fee Simple
Key Highlights
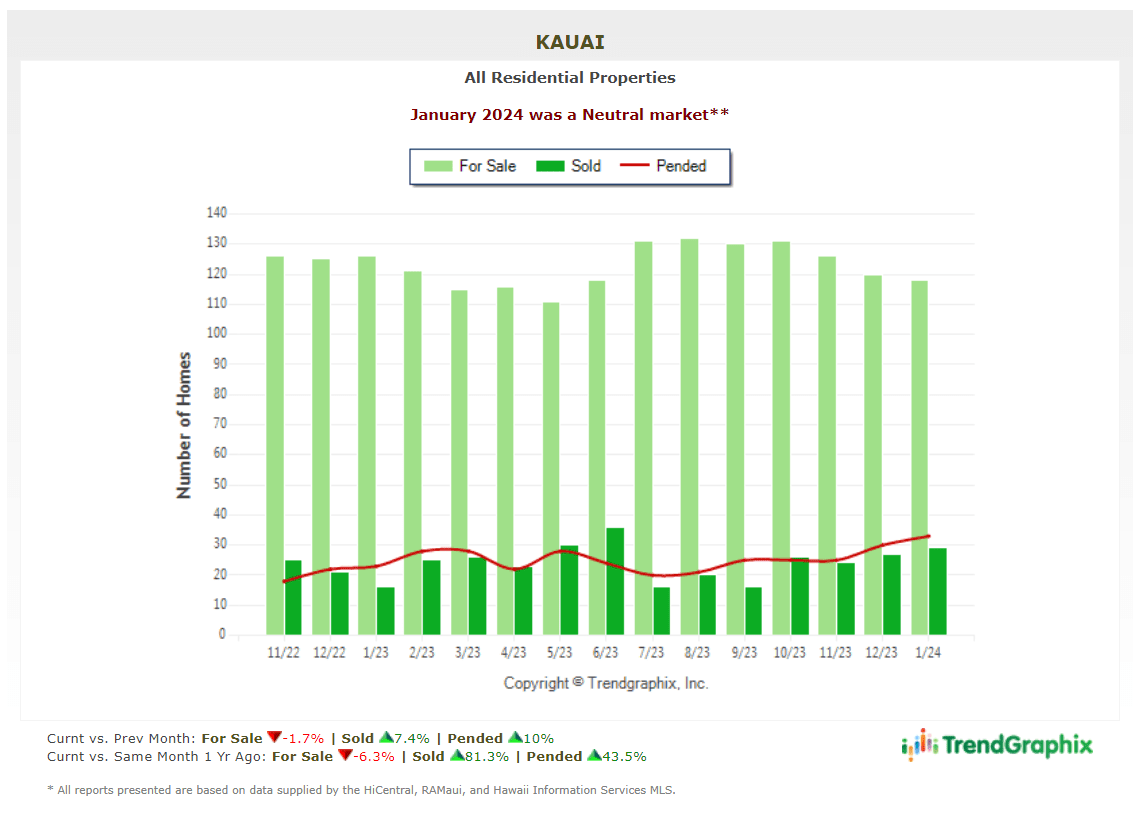
January witnessed a dynamic shift in the housing market with notable trends in property sales, inventory, and pricing analysis.
-
Property Sales: Significant increase with 29 properties sold, marking an 81.3% increase year over year and a 7.4% increase from the previous month.
-
Inventory: The total number of for sale listings decreased by 6.3% from the previous year and by 1.7% from the previous month.
-
Under Contract Listings: Saw a 10% increase from the previous month and a 43.5% increase from the previous year.
Pricing Trends
The Average Sold Price per Square Footage saw a significant rise, indicating a strong market appreciation.
-
Average Sold Price per Square Footage: Remarkable increase to $1,256, up 43.2% from the previous month and 78.2% from last year.
-
Median Sold Price: Rose to $1,430,000, up 7.9% from the previous month.
-
Average Sold Price: Increased to $2,494,000, up 42.8% from the previous month.
-
Average For Sale Price: Was $4,048,000, up 2.8% from January 2023 and 10.9% from the previous month.
Market Dynamics
Observations on Months of Inventory, Days on Market, and the List-to-Sold Price Ratio reveal insightful market trends.
- Months of Inventory Based on Closed Sales: Decreased to 4.1 months, down 48.3% from the previous year.
- Days on Market: Slight increase of 6.7% from the previous year, indicating a neutral trend.
- Sold/Original List Price Ratio: Improved to 94%, indicating sellers are getting closer to their asking price.
6 Month Trend Analysis
Both Average and Median Sold Prices are on an appreciating trend, reflecting robust growth in property values.
Absorption Rate
Detailed analysis on Closed Sales and Pending Sales absorption rates showcase the market's responsiveness.
-
Based on Closed Sales: The absorption rate of 24.6 represents a 93.7% increase compared to last year, indicating a higher pace of sales.
-
Based on Pended Sales: The rate of 28 signifies a 53.1% increase from last year, showing continued strong demand.